AI TOOL / #02469
Chartify
AI-driven chart and graphic generation enabled through natural language queries.
Introduction
AI-powered chart and graph generation from data using natural language queries.
What is Chartify?
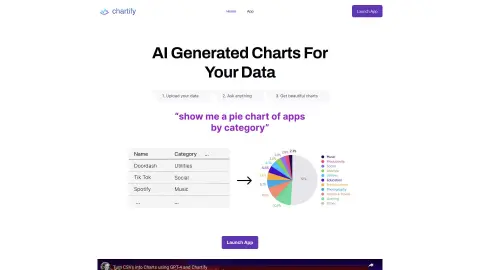
Chartify utilizes OpenAI’s GPT3 model to generate charts and graphs from CSV files and databases. You can use natural language to query the data and obtain both the visual representations themselves as well as the underlying code used by tools like Plotly, Matplotlib, and Seaborn. Convert CSV files and database tables into rich, interactive charts. Let our AI suggest new ways to visualize your data, or generate various types of charts according to your specific requirements – from pie charts to line graphs and bar charts.
How to use Chartify?
1. Upload your data (in CSV format, or via Postgres/MySQL).
2. Obtain the visualizations recommended by the AI system.
3. Submit questions to generate charts using Plotly, Matplotlib, Seaborn, or Charts.js.
The core features of Chartify
AI-driven chart generation
Natural language data query
Supports a variety of charting libraries, including Plotly, Matplotlib, Seaborn, and Charts.js.
Connecting CSV files to databases
Natural language data query
Supports a variety of charting libraries, including Plotly, Matplotlib, Seaborn, and Charts.js.
Connecting CSV files to databases
Related
Bitrig
Generate native Swift applications using AI.
ChartIQ AI
ChartIQ AI offers artificial intelligence-powered insights to enhance trading decisions and outcomes.
Cloudgov.ai
Agentic AI platform for autono...
WappGpt
An AI assistant built on WhatsApp, which utilizes the capabilities provided by OpenAI to offer personalized assistance and enhance productivity.
ChartEye – AI Chart Analysis
An artificial intelligence-powered cryptocurrency chart analysis tool that helps users make trading decisions quickly and accurately.
Laper AI
AI screenwriters and the collaborative process of scriptwriting